

 De
De  Es
Es  Fr
Fr  Pt
Pt 

-
-
-
-
-
-
-
-
-
-
-
-
-
-
-
-
-
-
-
-
-
-
-
-
-
-
-
-
-
-
-
-
-
-
-
-
-
-
-
-
-
-
-
-
-
-
-
-
-
-
-
-
-
-
Report Template
-
-
-
-
-
-
-
-
-
-
-
-
-
-
-
-
Report Template
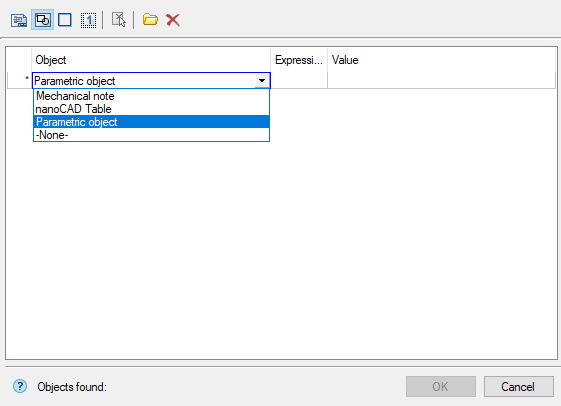
1. Call up the "Quick Selection" dialog box. Use the "Filter Objects..." command of the "Report Template" menu or the  "Select Source Objects" button on the right in the "Report Template" section.
2. Use the "Quick Selection" dialog to filter the objects and click the "OK" button. The selected objects will be associated with the report.
3. Select a cell in the "Report Template" section. In the context menu of the cell, the parameters of the related objects will be available for insertion.
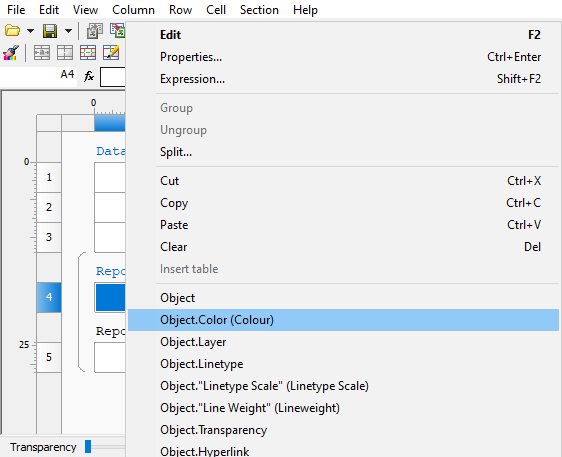
5. Select an option from the context menu. The "Report" subsection will be automatically created. The number of lines in the "Report" subsection corresponds to the product of the number of related objects and the number of template lines.
The report template can consist of several lines. To add rows in the context menu of the "Report Template" row, use the "Add Row" or "Insert Row" commands.
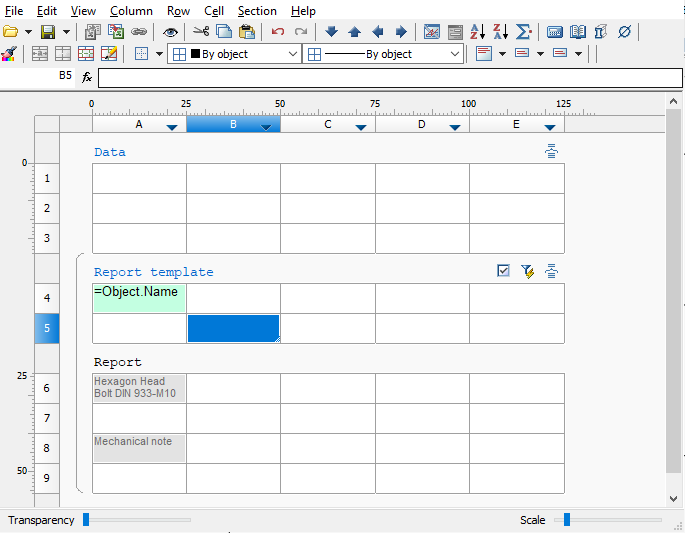
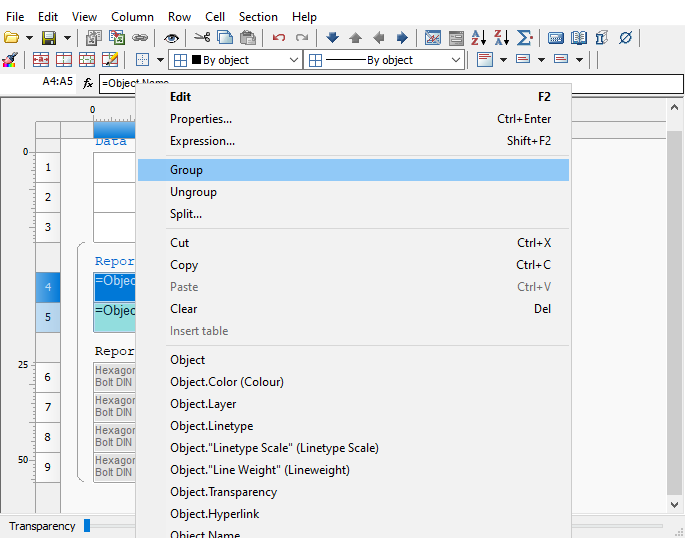
Rows in a report template can be combined. Changes will be displayed in the "Report" section. Let's consider a join using the example table below:
-
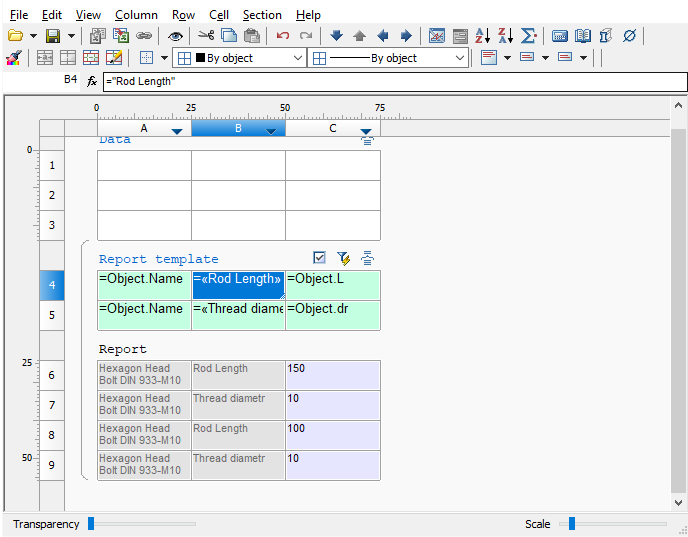
Select cell A1:A2 and select the "Group" command from the context menu. The selected cells will be grouped.
-
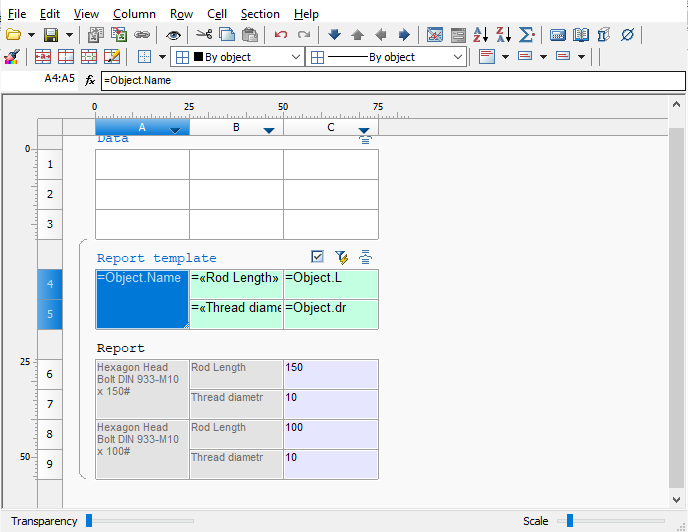
In the "Report template" menu (click on the subsection name), select the "Rebuild" command. The table will look like this:
6. Fill in all the required cells of the "Report Template".
7. The sample is formed. Close the table editor. Changing the parameters of objects in the drawing will change the values in the report.