
 De
De  Es
Es  Fr
Fr  Pt
Pt 

-
-
-
-
-
-
-
-
-
-
-
-
-
-
-
-
-
-
-
-
-
-
-
-
-
-
-
-
-
-
-
-
-
-
-
-
-
Viewport by Object
-
-
-
-
-
-
-
-
-
-
-
-
-
-
Plot Styles
 Ribbon: Home – Properties >
  Plot Styles
Ribbon: Output – Plot > Plot Styles
Menu: File –  Plot Styles…
Toolbar: Main –
 Command line: PLOTSTYLEMANAGER
A plot style is the same object property as a line type or color, and allows modifying an object’s view at plotting. Plot styles can be assigned to both individual objects and layers. Assigning of a plot style to objects or layers allows replacing their color, type and lineweight with other values that are not displayed on the screen, but appear only when plotted. One and the same drawing can be printed in different ways, for example, in color or monochrome, by assigning various plot styles to it.
Sheet content is displayed according to the plot style applied to that sheet. For example, if the print style is set to monochrome, the sheet content is also displayed in black and white.
The PSTYLEMODE system variable specifies the plot style mode of the current drawing: 1 – color-dependent or 0 – named.
Color-dependent plot style tables are based on objects colors and are stored in files of *.ctb extension. When selecting color-dependent style for plotting, all objects that share the same color will be plotted with the same parameters, for example, the same lineweight or the same line type. Plot styles in color-dependent style tables can be edited, but cannot be added or deleted. There are 255 styles in total, one for each color.
Named plot style tables are stored in files of *.stb extension and are assigned to the objects regardless of their color. When using named style, the objects that share the same color can be plotted with different parameters assigned to each object. Changing the print style for an object can be done using the Properties bar, for a layer – using the Layers dialog (Layers toolbar).
By default, plot style tables (files of *.ctb and *.stb extension) are located in the folder C:\Users\user_name\AppData\Roaming\Nanosoft AS\nanoCAD X.X\PlotStyles. The nanoCAD delivery set includes standard print style table files: Fill Patterns (the first 9 colors are configured as fill styles), Grayscale (all colors are converted to shades of gray when printed), monochrome (all colors are printed in black), Screening XX% (XX% of paint is used to output all colors).
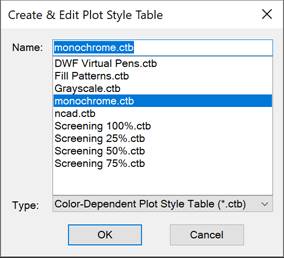
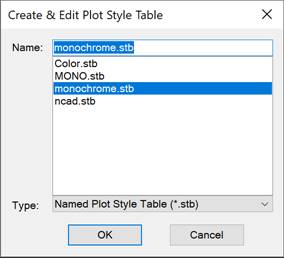
Plot style editor allows you to add, delete, copy, rename and edit the plot style tables. First the Plot style dialog box is opened, where the type of plot style table is selected (Color-dependent plot style table (*.ctb) or Named plot style table (*.stb):
After clicking OK button the Plot style table editor dialog box is opened. You can also open the editor by clicking the button from the Page setup dialog.
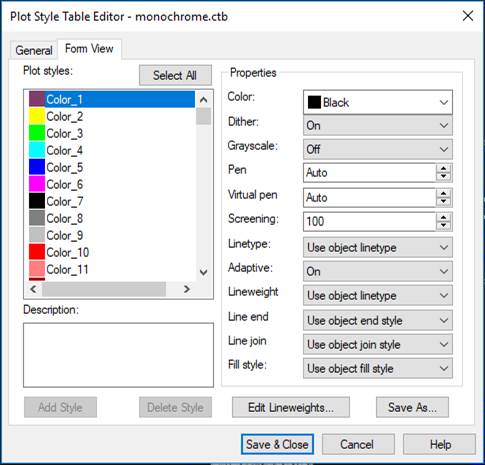
The General tab contains a description of the plot style table and general information about the file.
In the Form View tab, you select the plot style and modify its settings:
· Description,
· Color,
· Dither,
· Grayscale,
· Pen,
· Virtual pen,
· Screening,
· Linetype,
· Adaptive,
· Lineweight,
· Line end,
· Line join,
· Fill.
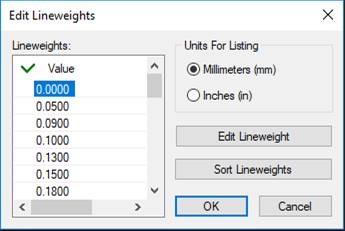
The Edit Lineweights button opens the Edit Lineweights dialog box to change the available lineweight values:
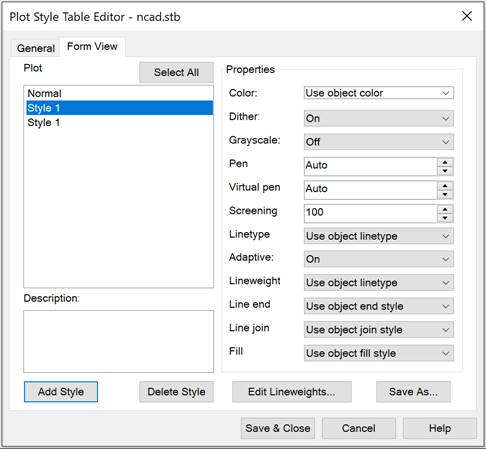
To add a new named plot style:
1. Open the Plot Style Table Editor.
2. On the Form View tab, click the Add style button.
3. In the Add Plot Style dialog box, enter the name of the new plot style. Click OK button.
4. Click the Save & Close button. The created plot style can be assigned to an object or to a layer.
To delete a named plot style:
1. Open the Plot Style Table Editor.
2. On the Form View tab, in the Plot styles list, select the style to be deleted
3. Click the Delete Style button.
4. Click the Save & Close button.
To create a new plot style table:
1. Open the Page Setup dialog box.
2. In the Plot style table drop-down list, select the New… line.
3. In the Create & Edit Plot Style Table dialog box, enter the name of a new table and select the type. Click OK button.
4. In the Plot Style Table Editor dialog box that opens, set the plot styles parameters. Click the Save & Close button.
To assign a plot style to objects:
1. Uncheck the Color Plot Mode box in the Page Setup. In the drop-down list, select the named plot style table. Click OK button.
2. Select objects in a drawing for which it is necessary to change a plot style.
3. In the Properties bar, in the General section, select Plot style from the list of available styles. The Other… plot style opens the Plot styles dialog box, where you can reassign the plot style table and edit the plot styles.
To assign a plot style to layers:
1. Uncheck the Color Plot Mode box in the Page Setup. In the drop-down list, select the named plot style table. Click OK button.
2. Open the Layers dialog or the Layers toolbar and select a layer for which it is necessary to change a plot style. In the Plot Style column, select the style from the list of available ones. The Other… plot style opens the Plot Styles dialog box, where you can reassign the plot style table and edit the plot style.