-
-
-
-
-
-
-
-
Cloud Coloring by Raster
-
-
-
-
-
-
-
-
-
-
-
-
-
-
Cloud Coloring by Raster
 Ribbon: Point Clouds – Settings >
  Cloud Coloring by Raster
 Menu: Point Clouds – Settings >
  Cloud Coloring by Raster
 Toolbar: Settings Point Clouds 3DScan >
  Cloud Coloring by Raster
 Command line: PC_COLOR_ORTHO_PHOTO
Airborne lidars almost never have an optical link and do not record the color of points. The Cloud Coloring by Raster command allows you to use the result of orthophotography to color a point cloud. It recolors cloud points according to the specified raster image of TIF format changing the cloud scan color (values of the Scan Color attribute).
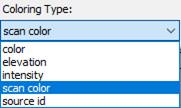
After coloring the cloud by raster, the cloud view mode automatically switches to coloring by scan color:

Command prompts:
|
Choose a raster by selecting it in a document or opening a file? [select/open] <select>: |
Select – select a raster file in the drawing field for coloring the cloud. Open – in the file selection dialog that opens, specify a raster file with the TIF extension. Then specify the corresponding coordinate file – TFW file (Tiff World File). The World-file name must be equivalent to the name of the raster file you are opening. A World-file is an ASCII text file containing the coordinates of the upper left corner of the ratser image, rotation and scaling values. Allows you to position the TIF file in the workspace. 1. pixel size along the X axis. 2. rotation around the Y axis (0.0 – no rotation). 3. rotation around the X axis (0.0 – no rotation). 4. negative pixel size along the Y axis (negative value, because the Y axis of the raster file is inverted. Since the pixel is square, the values in lines 1 and 4 are the same in absolute value). 5. X-coordinate of the center of the top left pixel. 6. Y-coordinate of the center of the top left pixel.
For example: 0.704006 -0.020843 -0.020843 -0.704006 635386.416868 853565.869621 |


 De
De  Es
Es  Fr
Fr  Pt
Pt 
